

Mapping Politics
Mapping Politics
Plus project updates and an invitation

Your invitation
Next Event: 7th May, Newspeak House – Learning from the Locals
Election technologies will have just had their first big test of 2024: the local elections.
What did we learn?
What do we need to build for the upcoming general election?
There will be lightning talks followed by an unconference.
RSVP: https://lu.ma/electiontechmeetup3
Questions? Join the WhatsApp group: https://chat.whatsapp.com/KjM4onZAg4U60FAm89XRQW
Handbook and Project Updates
30 or so new projects have been added to the handbook in the last week! You can check them out here: https://electiontechhandbook2024.uk/
If you’re building technology for the upcoming election, we want to hear about it!
The House of Commons Library is looking for feedback on https://electionresults.parliament.uk/ (email hcenquiries@parliament.uk)
You can read the roadmap here: https://electionresults.parliament.uk/meta/roadmap
It’s a key piece of democratic infrastructure that you have the opportunity to shape.
Common Knowledge have launched a prototype of Mapped, their incredible tool for mapping and engaging your members:
https://mapped.commonknowledge.coop/
It’s a tool for organisers and activists to locate their people by constituency and then drawn in any rich information that’s necessary for your campaign.
Mapped can help with recruiting, canvassing or fundraising, without storing any of your data. Our event at Newspeak House on the 11th April saw an extraordinary demo of the new version of this technology – many minds were blown!
A new version is launching soon – stay tuned.

At the same event, mySociety presented their extremely rich project Local Intelligence Hub. Built with The Climate Coalition, the tool allows you to explore huge amounts of data about local areas relevant to campaigners: https://www.localintelligencehub.com/

mySociety also presented MapIt, a key piece of infrastructure for the entire election tech landscape: https://mapit.mysociety.org/
Political mapping
"Maps are never value-free images" – John Brian Harley
What’s a map good for? The answers are perhaps obvious: for getting you somewhere or for showing you what an area is like. But maps, especially maps of politics, are endlessly, almost necessarily, controversial.
Perhaps the most famous controversy in mapping relates to the Mercator projection:

Dating from 1569, the map famously shows countries with hugely unrealistic sizes: Greenland appears larger than Africa, although its true area is a mere 14th of the continent’s size.
It was this distortion that allowed a Danish diplomat visiting China in the 19th century, desperate to impress his hosts, to remark in an offhand manner that Greenland, with its seemingly vast size, was in fact the least important of his country’s colonies.
In the postwar era with its widespread decolonisation movements, the projection became increasingly controversial. The German historian Arno Peters spearheaded the widespread replacement of the Mercator by the Gall-Peters projection, which shows the correct sizes of countries at the cost of distorting their shapes.

However justified complaints against the Mercator projection, there was a clear logic to its construction. Instead of a tool for showing the layout of the earth from above, it’s really a tool for navigation. You can plot a straight-lined course anywhere in the world, calculate the compass bear of that route, move along it, and arrive at your destination.
That isn’t true of most projections.
The conflict between the Mercator and Gall-Peters projections (not to mention the rest of the other possible projections) points to a trade off between using a map to get somewhere and using a map to find out what there is.
And, more generally, it raises the possibility that might be generally true of maps: that they can be useful not just despite of being wrong, but useful in part because they are wrong.
The upcoming General Election will be based on new boundaries.
There are several tools now available for finding out where your new constituency is. Put in your postcode and you’ll be able to see how the boundaries have changed:

The Sky News tool includes also information about demographic changes between the old and new constituencies. Some of these demographics are politically important. The Guardian wrote that
Estimated results under the new boundaries increase the Conservatives’ current constituency tally by seven from 365 to 372. Labour’s total is reduced by two from 203 to 201, including the speaker’s seat. This means that Sir Keir Starmer would now need a net gain of 125 seats for a majority.
As ever, the drawing of a map is not a neutral act.
Most of these tools suffer from outstanding issues because of problems with the underlying data. The Guardian summarises:
The Guardian’s map has been sourced from the individual boundary commissions of the UK. The Ordnance Survey will produce their own updated constituency map which will give further granular detail of the boundaries. The recommendations of the boundary commissions are, however, final and have been accepted into law by the privy council. A very small number of postcodes are split between constituencies; in these cases, the search will return the constituency that covers the centre of the postcode area.
There are many other exciting map projects projects in the Handbook.
Election Maps
https://electionmaps.uk/ has a wealth of maps of UK elections.
One of the most useful maps is the Nowcast: https://electionmaps.uk/nowcast. It shows what the general election map would look like if current polling was borne out. Even with their prediction for an enormous election slide, quite a bit of England still looks like it would vote Conservative.

That’s misleading, as the equal-sized constituency hexmap makes clear:
The black constituency of Chorley is for the Speaker of House of Commons, traditionally uncontested.
Election Maps uses Flourish, a set of data visualisation tools and a project also featured in the library section of their handbook with their blog post on visualising UK elections: https://flourish.studio/blog/visualizing-uk-elections/
West Ham and Beckton
https://westhamandbeckton.com/
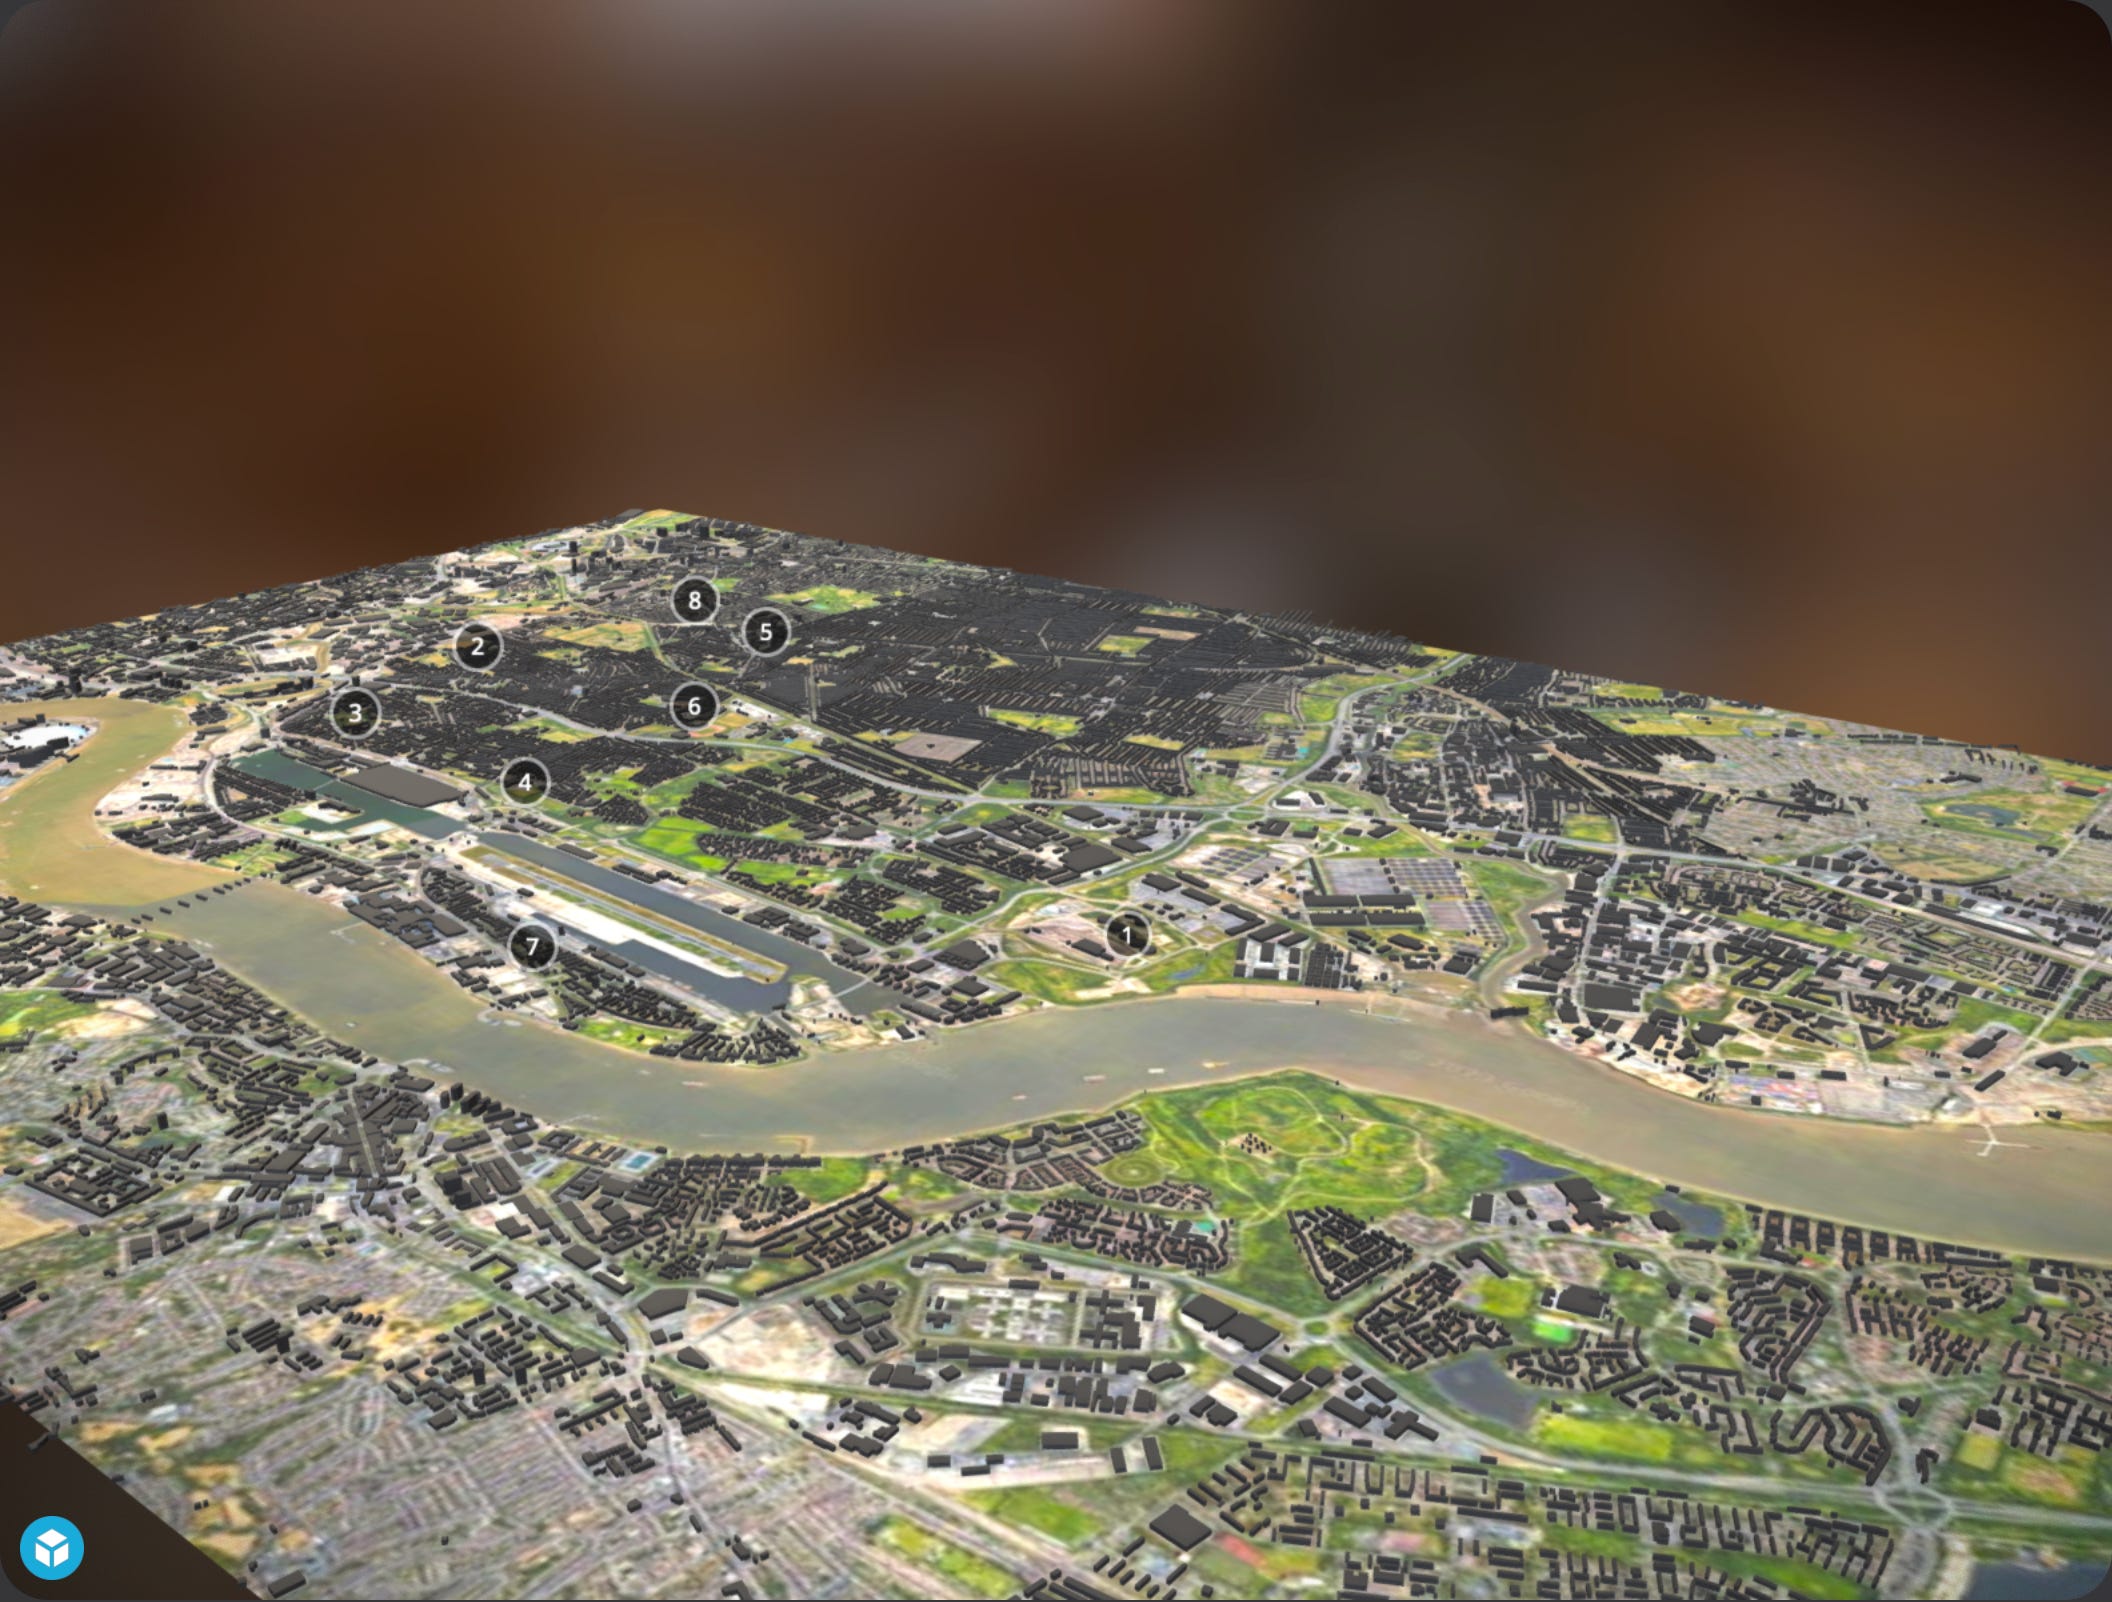
Another, earlier stage, project in the handbook is also enticing. On the website you can see a rotatable map of the new constituency, which will be filled with data by constituents.
If Campaign Lab’s Hannah O’Rourke’s prediction (voiced when she spoke at the first Election Tech Meetup) is correct, and we’re going to see 650 locally fought elections instead of one single national election, then these local mapping projects will likely become very important.
Could you make one for your own constituency? Join the WhatsApp group to co-ordinate with others: https://chat.whatsapp.com/KjM4onZAg4U60FAm89XRQW
Geospatial by Delib
https://www.delib.net/citizen_space/geospatial
Delib’s ‘Geospatial’ project allows respondents to surveys and deliberation processes to draw directly onto maps: creating richer data than written responses and allowing people to express more intuitively their insights into the spaces they live in.
Note that this is a paid project. The Election Tech Handbook contains both free and paid projects.

Mapping Movements
Over in the library section of the handbook – https://electiontechhandbook2024.uk/library – we have ‘How to Map a Movement’ by Natasha Adams. This discusses mapping of a more abstract kind: movement mapping. There are many ways to do this, each of which with their own nuances and considerations. Natasha lists:
Listing out your actors
Movement ecology
Relationships, power and conflict
Problem centred theory of change
Historical timeline
How can these techniques be better served by new technologies? Or combined with more conventional spatial maps?
What’s next?
What else could be built with maps? What other maps do we need? Add your ideas to the ‘Ideas’ section of https://electiontechhandbook2024.uk/ or post them in the WhatsApp group for the Election Tech Handbook: https://chat.whatsapp.com/KjM4onZAg4U60FAm89XRQW (this is a new group for 2024)
Campaign Lab is working on a new project that gathers data about local areas. They’re also hosting a hack day just after the local elections: https://lu.ma/xefiztyh
RSVP to our next event here: https://lu.ma/electiontechmeetup3
We’ll be talking about what we can learn from the local elections and planning exciting new technologies for the general election.